Skills

Lean, User Journey, Visual design, Wireframes

Tools

Figma, Miro, Whimsical, Photoshop, Illustrator

Year

2020

Owndata

This project was put forward in our Bootcamp as a sample of a challenge someone would have to face in order to get a job in a company like 2gether. The principal objective of this project is to design a mobile application to visualise the time spent from a user on her device as well as on her favourite applications.

Overview

2gether is a finance digital platform which works with different technologies such as IA, Big Data, Blockchain and cryptocurrency. In order to accurately assess the objectives needed for designing a solution for the requested task, I have encompassed the process in three main scenarios: research, ideate and design.

Onboarding

Starts with its launch screen and its logo, and then it is the Walkthrough which explains the main goal of the application. Also I chose to make a simple Sign up process at the beginning in order to achieve the WOW, Aha or Eureka moment sooner.

Homescreen & Data management

This navigates through the homescreen showing its side screen to the data management screen, where the user can go to the trade screen as well as to the Data Market if she clicks on the “Trade” CTA’s button.

Data Market

Here is where the users can exchange their data they have been generating, therefore this is the Data Marketplace. Below the “blockchain” cards, are the built up offers for the user. Depending on the data she enables , offers will be more personalised.

Wallet

The user can add different credit cards as well as being able to see a visualisation below of all the transactions done with them. In addition, I placed a FAB button so it could drive the user to an overlay screen with common wallet actions like sending, adding, or exchanging ETH (or the coin that is configured).

Kick off - Research

Research Questions & Desk Research

The way I started this project was with some research questions in order to describe the future situation of the the business. Therefore I sort the questions through their principal actors who will take part in the market in the future interaction of this project: 2gether, the competence and the user.

Benchmarking

In this part of the project I did a comparison of other companies and app solutions focused on finace applications and taking into acount the cryptocurrency.

Customer Journey

The User Journey shows the needs that happened during Anna’s day. These needs are shown as pain points and gain points. Through this exercise one can put oneself in the shoes of others better, because the practice goes through the problem that the user experiences during her day.

Ideate

User Stories

In this part of the project I identified the functionalities that the MVP should have through the users’ stories, which are based on their main needs. Below there are some of the functiionalities.

MoSCoW & Flowchart

At this moment it is important to decide the priority over functionalities to define the user paths. The image below it shows already the flowchart with the MVP’s information architecture and its principal actions.

Low fidelity wireframes

Now is the moment of sketching and designing the first low fidelity wireframes. Below are some sketches I made by hand to visually start organising the former ideas and functionalities described that define the value of the future MVP.

Design

Style Guide

At this point of the project I created a design system in order to facilitate the work for future designers in the company so everything sticks together in an accessible and simple way . To start having some inspiration I did a moodboard in order to set the colours and the future environment of the application.

Prototype & High fidelity wireframes

This image below shows how the prototype was done in Figma. Next are all the screens displayed in detailed.

Onboarding & Sing up

Data market, Data Management & Wallet

Conclusions

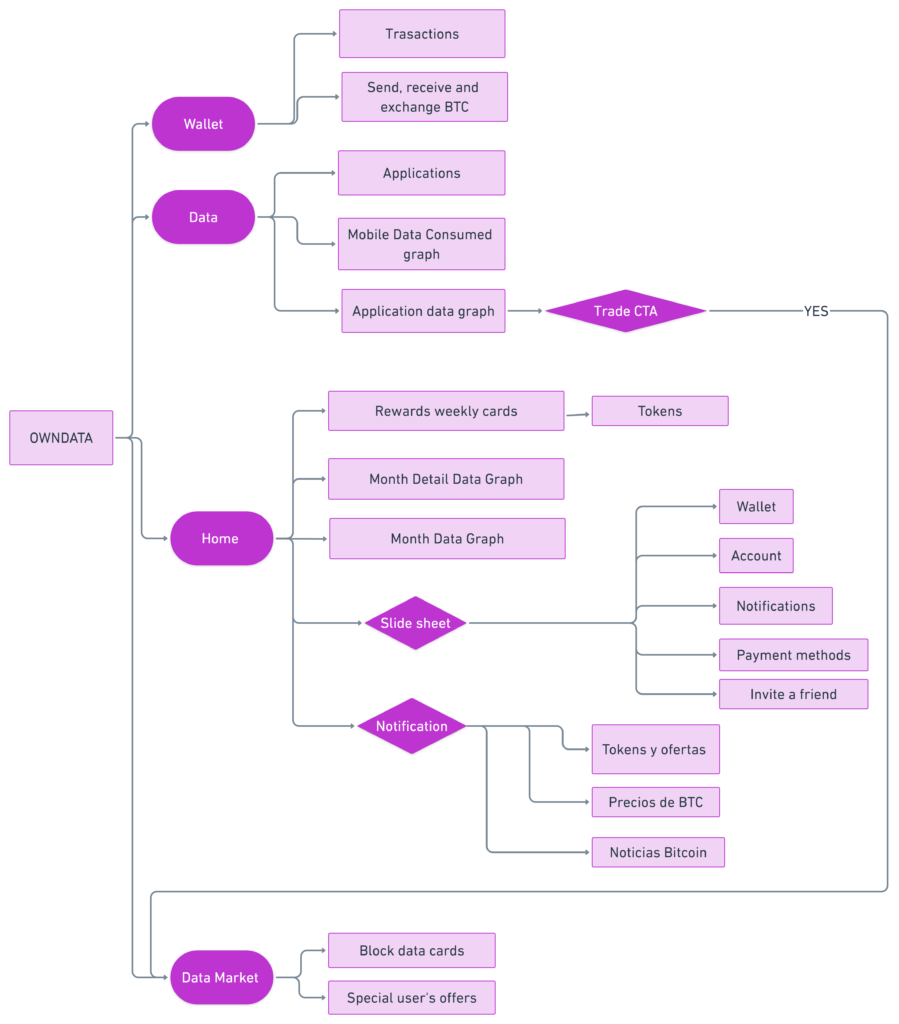
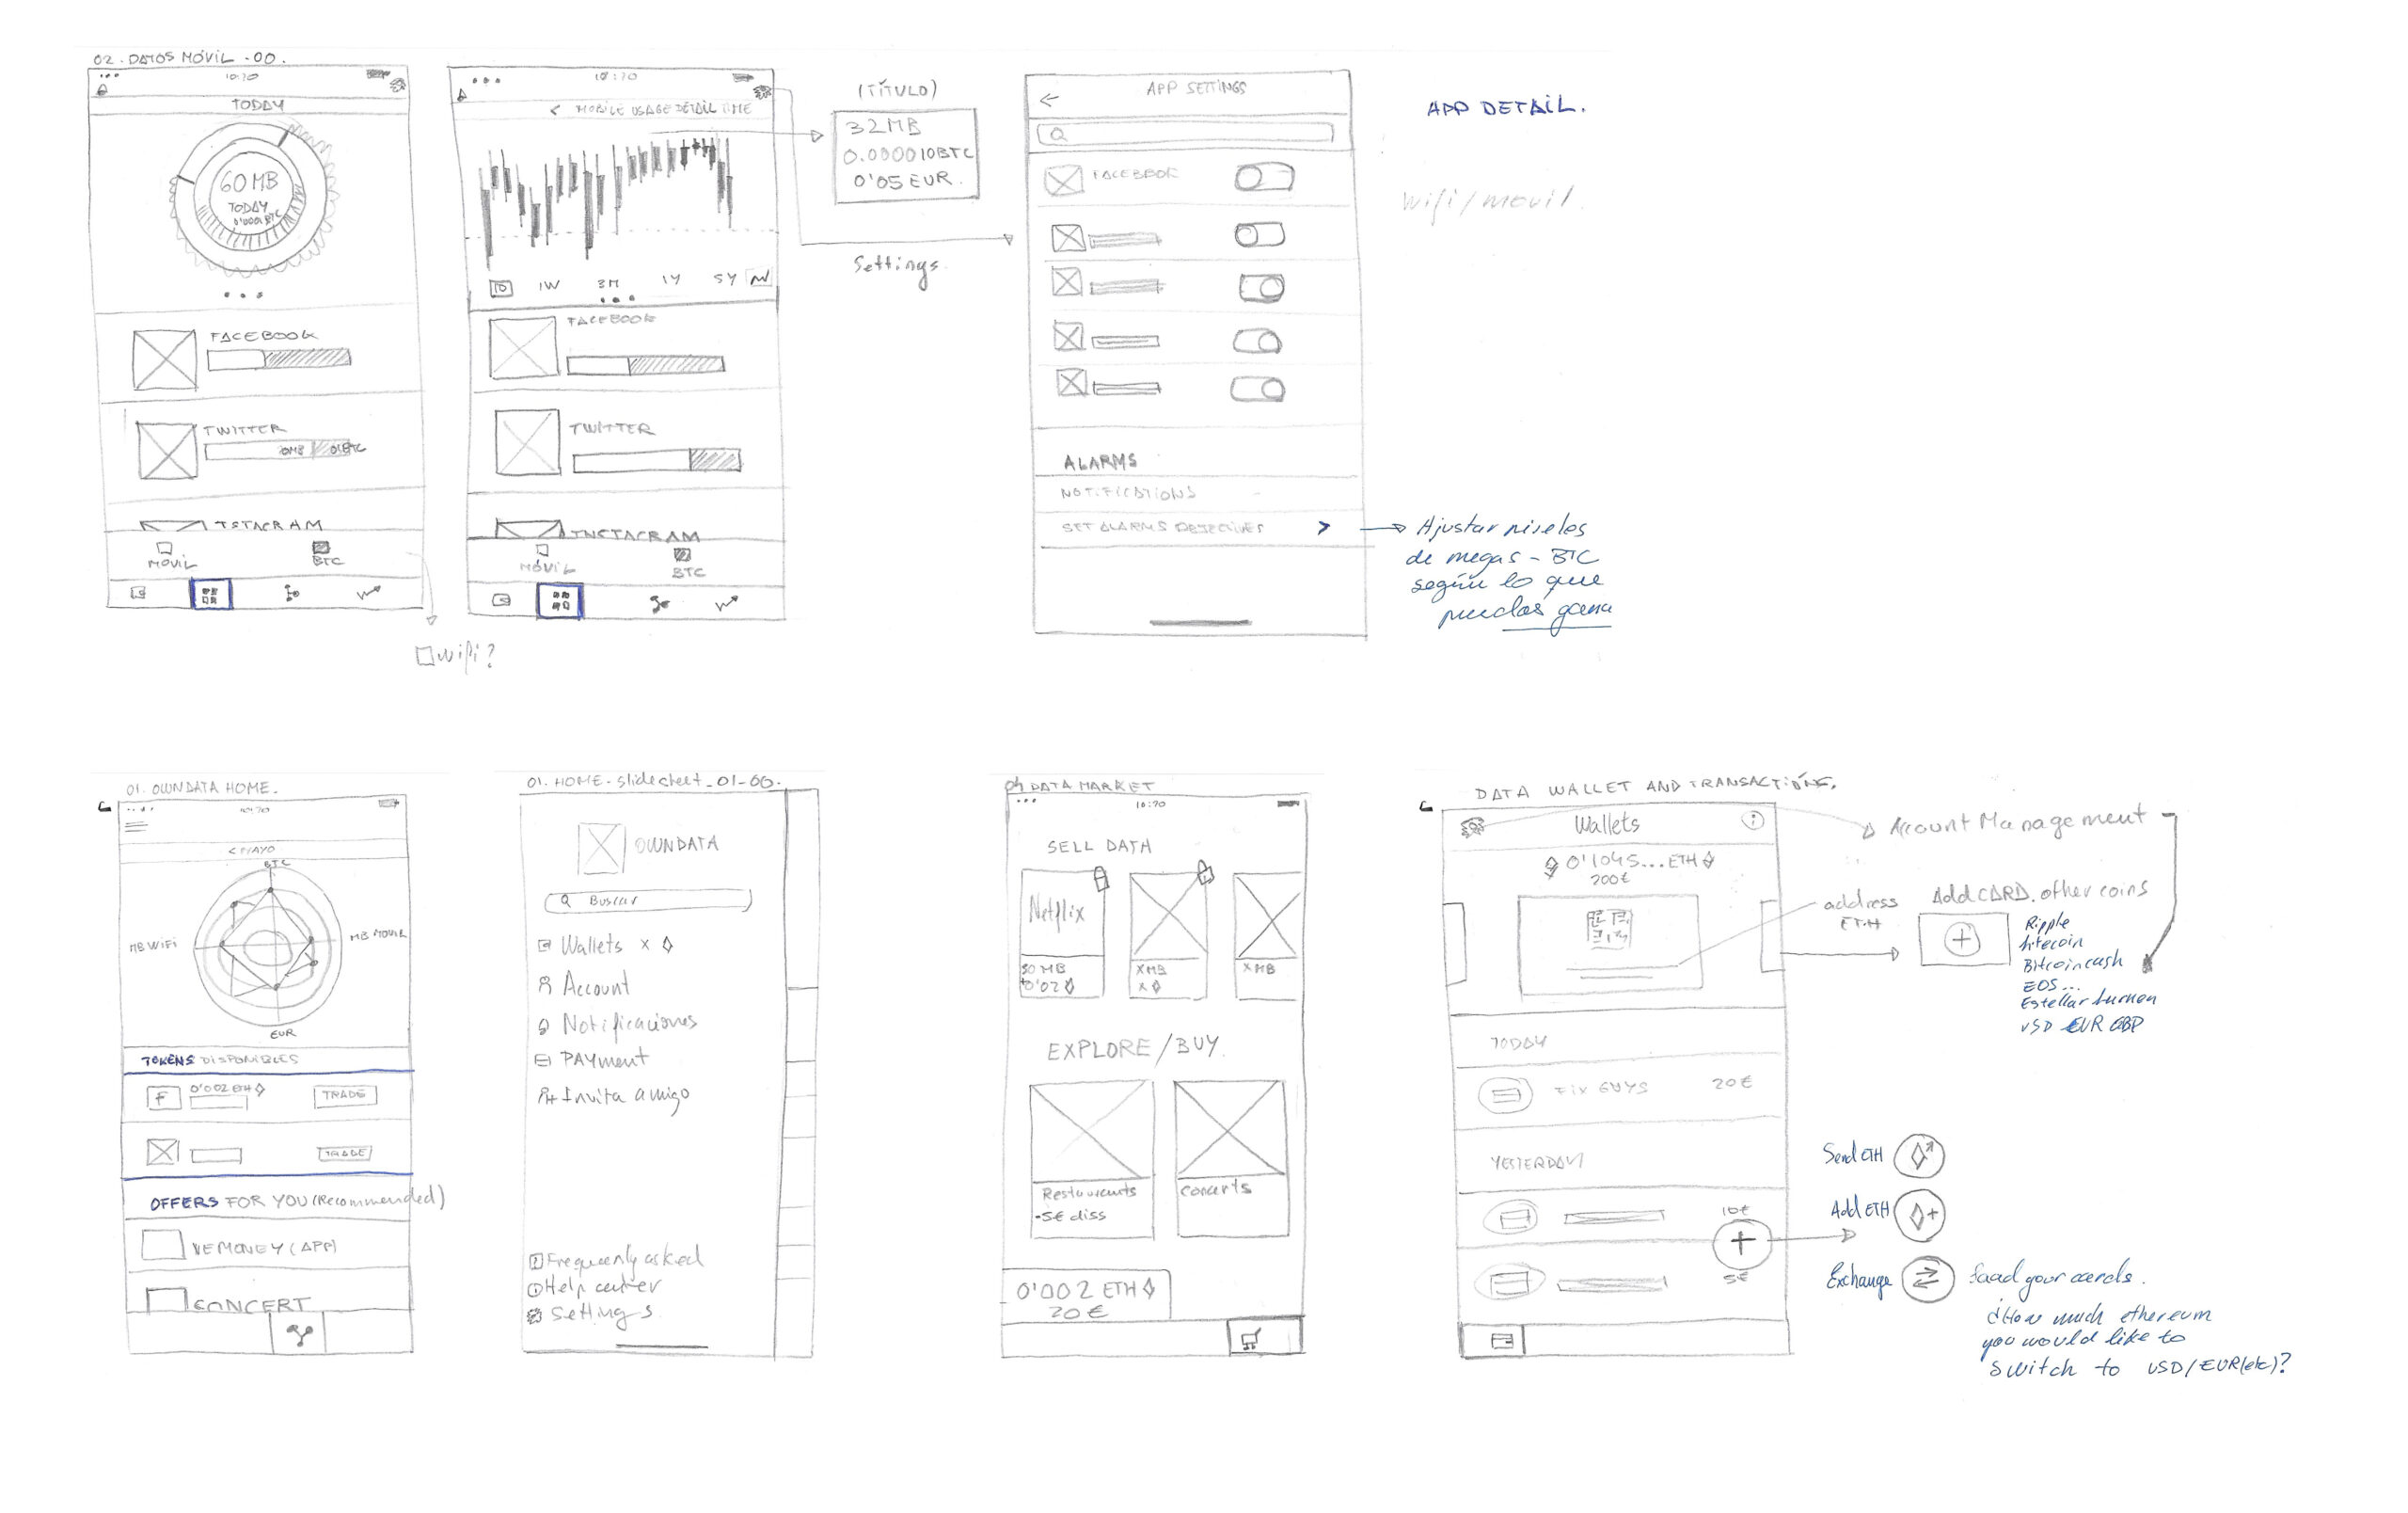
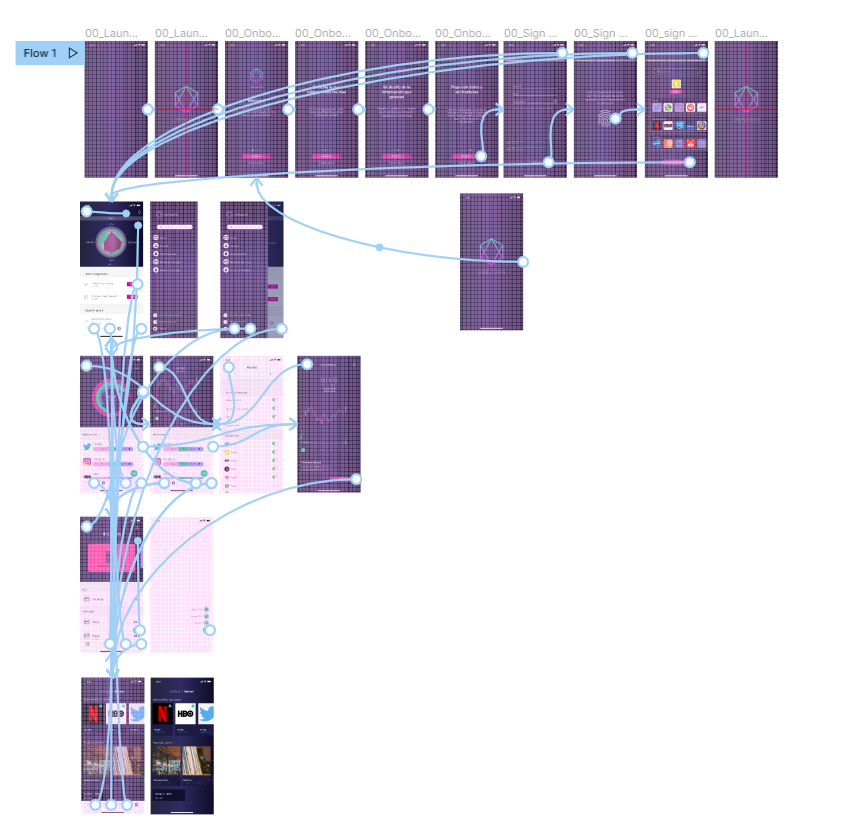
Despite all the difficulties at the time of conceptualising the idea, these would be the very first steps of my MVP. The next steps would be making a Useberry or Maze test for getting real feedback from the project.


Finally, after doing these supposed MVP developments, if they have positive feedback, I would create a Business Model Canvas to identify objectives and main actors that would take part in this future business. Then, after this last practice, I would definitely need feedback from the market. Therefore, I would launch a Landing website in order to analyse and count its feedback thanks to the metrics of Google analytics, a list of KPI’s, the number of heatmaps, polls, and recordings on Hotjar and so on, always through a build-up and iterative process until finding the most successful solution!